
VISUAL ARCHIVE / IMAGE STORY
What the Collected Rates Show
A distribution is evidence about a sample, not a law for all life.
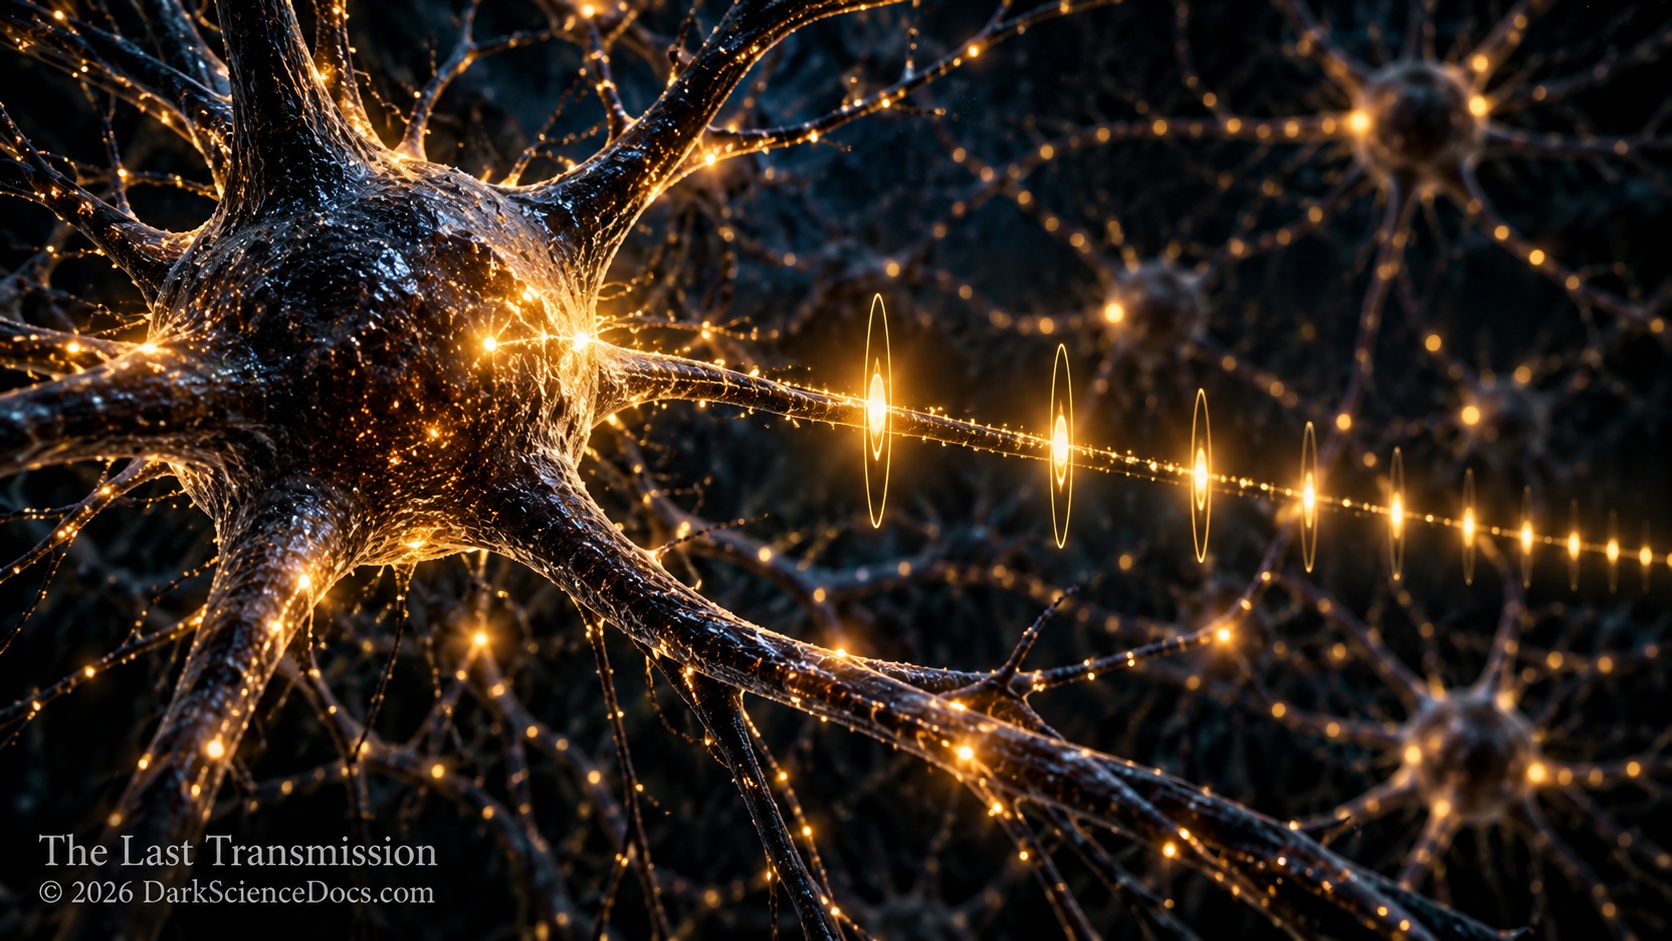
When communication rates from very different animals are placed together, a remarkable concentration emerges around only a few events per second, as though evolution has repeatedly discovered the same useful window.
THE OBSERVATION
What we can actually see.
Plotted communication rates suggest a relatively narrow slow window among selected examples. The interpretation must account for how signals and periods were defined and how cases entered the comparison.
THE ILLUSTRATION
What the artwork imagines.
The immaculate bands and alignment are explanatory graphics rather than digitized study data. They must not be used to read exact species measurements or infer universal synchrony.
FROM THE ILLUSTRATED ARTICLE
The story that inspired it.
The cross-species study reports a clustering of signal rates and develops a receiver-based explanation; the article then explores explicitly speculative extensions. A distribution is evidence about a sample, not a law for all life.
Read Life May Be Speaking in the Same Hidden RhythmCHECK THE RECORD
The image interprets the research below. Follow the original work for the measurements and limits behind the scene.
PLOS Biology: cross-species communication tempoOTHER IMAGE STORIES
 Many Voices, Similar Paces
 Two Rhythms, Different Causes
 The Mark Shared by Titan and Pluto