
LIGHT LAB / THERMAL IMAGING
The Invisible World
See what warmth leaves behind.
An ordinary room holds a second story. Start with a thermal handprint, uncover a star hidden in cosmic dust, then investigate how a probe survives near the Sun. Follow the infrared from a room on Earth into astrophysics.
01 / START IN A ROOM ON EARTH
A hand lifts. A trace remains.
Press Lift the hand to start the simulation.
The hand is resting on the panel. The scene will wait for you.
Two views of one modeled room.
A warm hand touches a cooler panel. After it lifts, the panel retains a warm print. Polished metal can reflect infrared from a warm target; ordinary window glass blocks the direct infrared view of a warm figure behind it.
The numerical starting cases and complete text activity are available below, including when 3D graphics or JavaScript are unavailable.
The white ring marks the selected panel and follows the chosen material.
Coffee steam is an illustrative condensation plume. Its infrared visibility can be much fainter and varies with droplets, temperature contrast and camera wavelength. The plume moves only while cooling plays.
Preparing the 3D room. The starting examples and text lesson below are already readable.
Displayed range: 18 °C / 64 °F → 36 °C / 97 °F
Leave a thermal ghost
Hand down · paused after 30 s of modeled contact
The scene starts paused at the end of the chosen contact duration. Press Lift the hand to start the simulation. The slider and shortcuts show time since lift. The hand is held at 34 °C / 93.2 °F, or the mug base at 52 °C / 125.6 °F; the room starts at 21 °C / 69.8 °F. Lifting starts cooling at 30× model time; pause or replay it with the controls. If reduced motion is enabled, cooling waits for Play.
Is that metal really warm?
A warm target stands in front of a room-temperature metal vessel. Turn the viewing angle, then compare the polished-metal marker with its matte patch. Both are held at the same actual temperature.
The bright reflection changes with geometry. The matte patch emits a much larger share of its own signal.
One pane. Two different views.
The warm figure is visible behind the window in ordinary light. In the modeled infrared view, you see the glass surface’s own infrared signal instead. The foreground coffee and its illustrative steam are on the camera’s side of the glass.
This is ordinary window glass in an idealized long-wave infrared comparison. It is not an X-ray view or a claim that every kind of glass blocks every infrared wavelength.
Move the viewpoint
Use the on-screen arrows to rotate or tilt both views, drag to orbit, or use the angle slider with a keyboard. Both images always use the same viewpoint. Choosing an inspection point brings that surface into view. The white ring and its label identify the same surface as the numerical readings; optional scene labels mark other objects.
Read the camera
Changing the palette or scale changes the picture, not the modeled temperatures. The infrared colors represent an idealized camera signal, not the visible color of heat.
PREDICT FIRST
When the hand is gone, what keeps the print visible? Which observation would tell you whether a bright patch is warm material or reflected infrared?
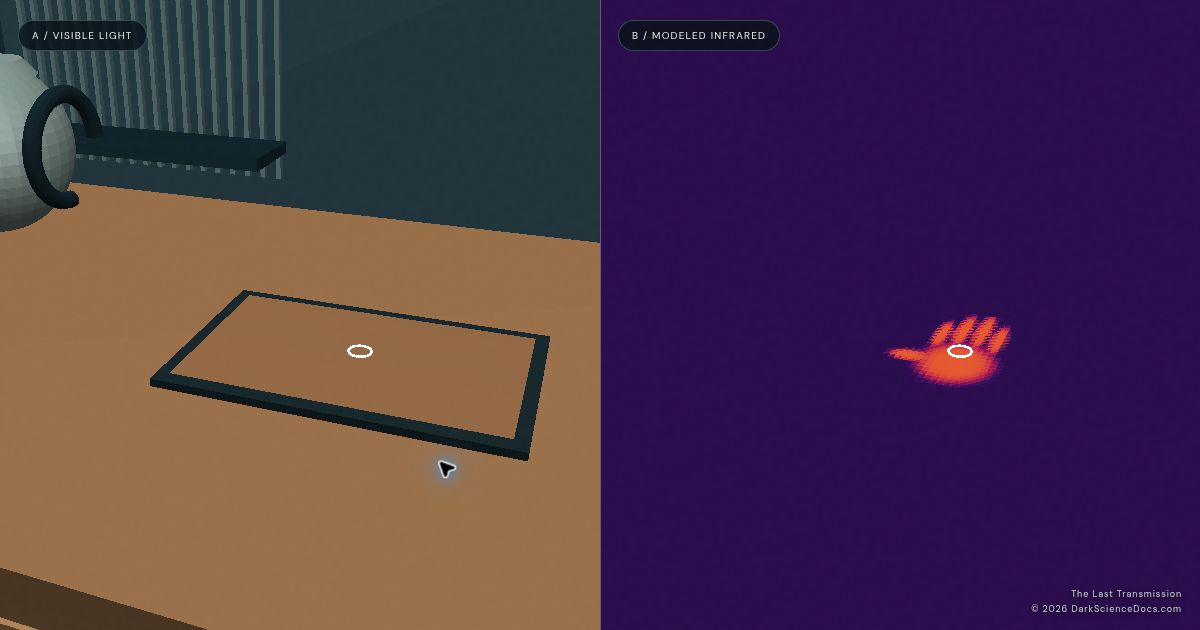
This generated example compares a room in visible light and modeled infrared. False colors map the camera signal using a chosen scale. It is an illustrative model output, not thermal-camera footage; use the current controls and numerical readouts to interpret your own result.
THE PHYSICS BEHIND THE REVEAL
Heat and temperature.
Different quantities. Different clues.
THE CORE IDEA
Temperature tells you how hot something is. Heat tells you how much energy crosses from one system to another because of a temperature difference. A high temperature alone does not tell you how much energy will reach the probe.
TEMPERATURE / °C · °F · K
A thermal state.
Temperature describes how hot or cold a system is. In a simple gas, it is related to the particles’ average random kinetic energy. A few very energetic particles can have a high temperature even when the gas is extremely sparse.
A temperature reading does not tell you the total energy available or how quickly energy will be transferred.
HEAT / JOULES
Energy being transferred.
Heat is energy transferred because of a temperature difference, through conduction, convection or radiation. Net thermal energy transfer is from hotter to cooler systems.
An object contains internal energy. The word heat describes energy in transit, rather than a substance stored inside the object. How much transfers depends on the materials, amount of matter, temperature difference and transfer process.
EXAMPLE / SAME TEMPERATURE
Two amounts of warm water.
Imagine 100 g (3.5 oz) and 1 kg (2.2 lb) of water, both starting at 60 °C / 140 °F. They have the same temperature.
If each cools to 20 °C / 68 °F, the smaller sample releases about 16.7 kJ; the larger releases about 167 kJ—ten times as much energy for the same temperature drop.
This idealized water-only example uses Q = mcΔT with c ≈ 4,186 J/(kg·K), constant heat capacity and no evaporation. It compares amounts of transferred energy, not cooling speeds.
Definitions and water heat-capacity example: OpenStax: heat as energy transfer and temperature change and heat capacity. The example is calculated, not measured.
01 / TRANSFER
The hand leaves energy.
During contact, energy transfers from the warmer hand or mug base to the cooler panel by conduction. After the hand lifts, that energy spreads through the panel while the panel exchanges energy with its surroundings. A visible print can remain even though the hand is no longer there.
Use the panel’s temperature reading and energy-above-room reading together. The stored energy is internal energy; conduction from the warm hand is how energy entered the panel as heat.
02 / RADIATION
The camera receives light.
Thermal imaging detects infrared radiation. For an opaque surface, the received signal can contain both radiation emitted by the surface and radiation reflected from elsewhere. The finish and viewing geometry influence how those contributions combine.
A bright reflection does not require the reflecting metal itself to become hotter. Compare a reflective patch with a matte one before interpreting the image as a temperature map.
03 / INTERPRETATION
The colors need a scale.
Infrared is outside human vision. The display assigns colors to signal values. The same temperature can look different when the display range or palette changes.
Ordinary window glass transmits visible light well but blocks the direct view used by typical long-wave thermal cameras. Here the glass is modeled as opaque at the camera’s illustrative 10 µm wavelength. Room furnishings use a uniform reflected room background; directional warm-target reflections are limited to the metal test surfaces. The glass uses a uniform reflected room background, so the window lesson shows its opaque surface without an extra target reflection.
Open the model, assumptions and limits
Model version Thermal311-1.0. All scenes, temperatures and camera images are generated. No thermal footage or measured thermograms are used. This is an educational model; it is not calibrated thermography, a building inspection or a spacecraft engineering tool.
Panel: a 70 × 42 cm (27.6 × 16.5 inch) thin panel, 8 mm (0.31 inch) thick, is represented by a two-dimensional, cell-centered heat equation. A smooth hand-shaped mask at 34 °C / 93.2 °F, or a circular mug-base mask at 52 °C / 125.6 °F, supplies a prescribed-temperature boundary through a 350 W/(m²·K) contact coefficient. The model includes lateral conduction, convection to 21 °C / 69.8 °F air at 5 W/(m²·K), and graybody radiation to surroundings at the same room temperature. Edges are insulated. The time step is limited for numerical stability.
The three panels have the same geometry and a standardized infrared emissivity of 0.95, isolating differences in thermal properties. Illustrative constants are wood: k = 0.12 W/(m·K), density 600 kg/m³, heat capacity 1700 J/(kg·K); aluminium: 205, 2700, 900; stone: 2.5, 2600, 800 in those units. These stand-ins are not specifications for every wood species, alloy or stone. The prescribed hand and mug temperatures can supply energy without cooling; real objects cannot do so indefinitely. The mug-base mask is a simplified flat circular contact. The three-dimensional hand is a visual stand-in for the smooth contact mask.
Infrared: the camera uses a single illustrative wavelength of 10 µm. It mixes Planck radiance from the surface with reflected radiation using emissivity, then converts that signal to blackbody-equivalent brightness temperature. This is a monochromatic teaching approximation, not an integration over a commercial camera’s wavelength band. The warm target is 35 °C / 95 °F; other reflected directions see the room. Curved-surface reflections use viewing geometry, with a softened edge to the target. The metal vessel and matte patch remain at 21 °C / 69.8 °F. The window is opaque in this infrared pass and transparent in the visible pass.
The camera model omits atmospheric attenuation, detector noise, calibration, rough-surface scattering, wavelength-dependent material data and optical blur. The visible rendering uses artistic lighting; its brightness is not a temperature measurement. White rings, labels and Sun-to-shield lines are annotations.
| Surface | Actual surface temperature | Reflected source | Camera brightness temperature |
|---|---|---|---|
| Polished metal · emissivity 0.08 | 21 °C / 69.8 °F | 35 °C / 95 °F target | 33.9 °C / 93.1 °F |
| Polished metal · emissivity 0.08 | 21 °C / 69.8 °F | 21 °C / 69.8 °F room | 21 °C / 69.8 °F |
| Matte patch · emissivity 0.96 | 21 °C / 69.8 °F | 35 °C / 95 °F target | 21.6 °C / 70.9 °F |
| Panel | Model time | Warmest point | Panel energy above room state |
|---|---|---|---|
| Wood | 32 s | 30.3 °C / 86.6 °F | 3152.2 J |
| Wood | 120 s | 29.3 °C / 84.8 °F | 2808.8 J |
| Wood | 600 s | 25.4 °C / 77.8 °F | 1503.4 J |
| Aluminium | 32 s | 25.2 °C / 77.3 °F | 4325.6 J |
| Aluminium | 120 s | 22.6 °C / 72.7 °F | 4124.3 J |
| Aluminium | 600 s | 21.6 °C / 70.9 °F | 3182.1 J |
| Stone | 32 s | 27.1 °C / 80.7 °F | 3985.0 J |
| Stone | 120 s | 26.7 °C / 80.1 °F | 3767.6 J |
| Stone | 600 s | 24.8 °C / 76.6 °F | 2777.5 J |
At a fixed time, heat spreading and total stored energy are separate quantities. Compare all columns before deciding which material “keeps heat.” Download the complete model-example CSV.
03 / APPLY ENERGY BALANCE NEAR THE SUN
A hot environment.
A different energy budget.
Parker Solar Probe travels through the Sun’s corona, where particles can have temperatures of millions of degrees. The probe’s temperature depends on its energy exchanges, so it does not simply become as hot as the surrounding particles. The corona is extremely sparse: energetic particles are widely separated, limiting the energy they deliver to the spacecraft through collisions.
Sunlight is a separate energy input. Radiation can transfer energy through nearly empty space, so sparse gas does not remove the need for protection. Parker’s reflective, insulating heat shield, correct orientation and thermal-control systems help manage that intense solar input. The distinction between temperature and heat transfer explains part of its survival; the engineering is essential too.
Use this separate, fictional probe model to compare particle heating with absorbed sunlight. Its numerical results are teaching examples, not Parker measurements. NASA explains Parker’s heat-versus-temperature distinction and shield.
A schematic probe sits behind a Sun-facing shield. Model results and the text explanation are available below even without the 3D view.
Original schematic, not Parker’s flight geometry. The front color highlights the warm shield; distances, solar size and lines are illustrative.
READ THE UNITS
A heating rate is a third quantity. The readouts in W/m² show energy arriving each second per square meter, not temperature. For example, 100 W/m² sustained for 10 seconds supplies 1,000 J to one square meter. The resulting temperature change also depends on the object’s heat capacity and energy leaving it.
See the distinction in the model: at the same particle temperature of 1,000,000 °C / 1,800,032 °F, increasing particle number density from 1010 to 1014 particles/m³ raises the idealized particle-heating rate from about 0.010 to 100.125 W/m². The gas temperature stays fixed while the rate of energy transfer increases. Absorbed sunlight remains 238,175 W/m² at the starting 500× setting; it dominates these illustrative cases. Compare the table below.
| Case | Sunlight relative to Earth | Particle density | Absorbed sunlight | Particle heating |
|---|---|---|---|---|
| Starting case | 500× | 1e+10 particles/m³ | 238,175 W/m² | 0.010 W/m² |
| Denser gas, same sunlight | 500× | 1e+14 particles/m³ | 238,175 W/m² | 100.125 W/m² |
| Less sunlight, same gas | 20× | 1e+10 particles/m³ | 9,527 W/m² | 0.010 W/m² |
What the space calculation includes
This is a two-node, steady-state energy-balance exercise. Sunlight is 1361 W/m² times the selected multiplier; the front absorbs 35% of it. A deliberately idealized neutral-proton gas supplies particle heating proportional to number density times absolute temperature to the three-halves power, with full energy accommodation. Electrons, plasma sheaths, charging, bulk solar-wind flow and magnetic fields are omitted. It illustrates separate temperature and density effects; it is not a quantitative coronal-heating prediction.
The shield radiates from two idealized faces with emissivity 0.85, and conducts energy to one body node. The body radiates with emissivity 0.8 and has a fixed internal heat input of 30 W/m². The background is 3 K. Temperatures solve those two energy balances at equilibrium; they do not describe a transient flyby. Geometry, solar absorptivity, conductance and all other numerical settings are illustrative and are not fitted Parker properties.
Changing one control holds the others fixed as a controlled teaching experiment. In the actual solar environment, density, temperature, distance and illumination can be related. The on-screen numbers must not be presented as Parker’s shield or instrument temperatures.
TRY THIS
Keep Incident sunlight, Particle temperature and Shield-to-body conductance unchanged, then adjust Particle number density. Watch Idealized particle heating: can the energy-transfer rate change while particle temperature stays the same? Leave particle temperature and particle density unchanged, then adjust the Incident sunlight slider. Compare Absorbed sunlight with Idealized particle heating, and explain why the modeled probe does not take on the particles’ temperature. Use the fixed comparison table if you are following the text edition.
FOR LEARNERS / EDUCATORS / CURIOUS EXPLORERS
Predict. Reveal. Explain.
A suggested 40–50 minute introductory activity for ages 14+ and introductory college discussion. This is a planning estimate, not a classroom-timed result. No account is needed and learner answers are not collected.
- Follow the handprint. The scene starts with the hand down and paused. Press Lift the hand to start the simulation, then predict whether the print disappears immediately after lifting. Compare wood and aluminium at the same contact duration and model time. Record a temperature and an energy value, then explain why they answer different questions.
- Investigate the bright metal. Compare the polished marker and matte patch. Change the viewing angle. Use actual surface temperature and camera brightness temperature to explain how a bright reflection can change without heating the metal.
- Test the window. Predict which view will show the figure behind the pane. Compare the images and explain why visible transparency does not imply transparency at the infrared wavelength used by this model.
- Read the colors. Keep the scene fixed and change the palette and range. Explain why “yellow means this exact temperature” is incomplete without a legend.
- Reveal the hidden nursery. Begin in visible light and predict what near-infrared will reveal. Compare source A’s transmission at 0.55, 2 and 12 µm. Select the warm dust knot, reveal its spectrum, and explain why dust colder than a room can be an infrared source. Change temperature and dust amount separately; describe how each changes the spectrum.
- Apply the idea to space. Keep particle temperature fixed and change Particle number density. Explain why the particle-heating rate changes without changing gas temperature. Then compare particle heating with absorbed sunlight, explain the shield’s role, and state one limitation of this simplified probe.
Keyboard: Tab to each native button, select and slider; use arrow keys on sliders. Numerical readouts, a fixed table, text explanations and a printable edition provide alternatives to the images. Colors are accompanied by labels and values. JavaScript enables the interactive 3D exploration; the text activity remains available without them. This page does not claim an accessibility certification.
CHECK THE SCIENCE
Follow the sources.
- University of Texas at Austin: thermal-camera demonstrations ↗
Handprints, energy transfer and the difference between visible and infrared views through a barrier.
- FLIR: emissivity and reflected radiation ↗
Why material finish and reflected surroundings affect thermal interpretation.
- FLIR: what a thermal camera can and cannot see through ↗
Ordinary glass, reflections and wavelength-dependent transparency.
- FLIR: thermal imaging and display scales ↗
How the chosen temperature range controls the distribution of image colors.
- OpenStax: temperature change and heat capacity ↗
Energy, heat capacity and the distinction between temperature and transferred energy.
- NASA: why Parker Solar Probe can survive near the Sun ↗
Sparse hot plasma, intense sunlight and the engineering role of the shield.
- FLIR: infrared imaging through moisture and fog ↗
Why droplets, water vapor and camera waveband can change infrared visibility. The coffee plume here is illustrative.
- NASA: infrared astronomy and hidden star formation ↗
Dust extinction, infrared emission and why different wavelengths reveal different structures.
- NASA: thermal continua, absorption and emission spectra ↗
The broad thermal spectrum and chemical fingerprints answer complementary questions.
- NASA: spectroscopy beyond visible light ↗
How infrared spectrographs extend the investigation of stars, dust, planets and galaxies.
Source review: November 4, 2026. Original models and procedural 3D graphics by The Last Transmission / DarkScienceDocs.com. All reported lab outputs are generated examples, not measurements.