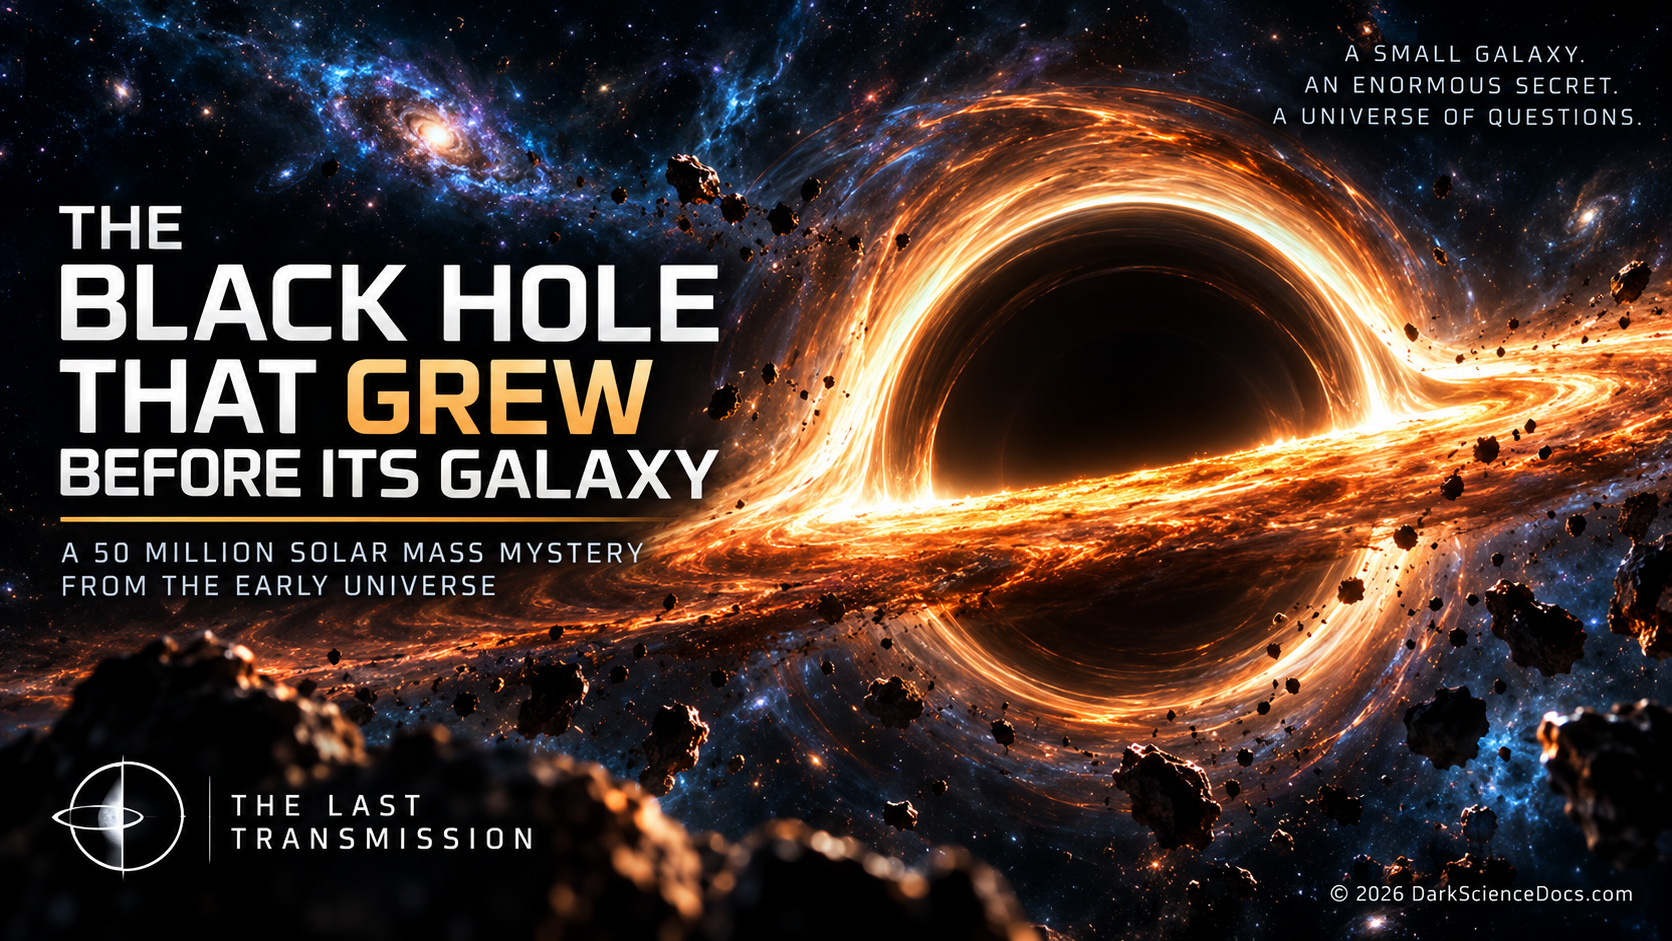
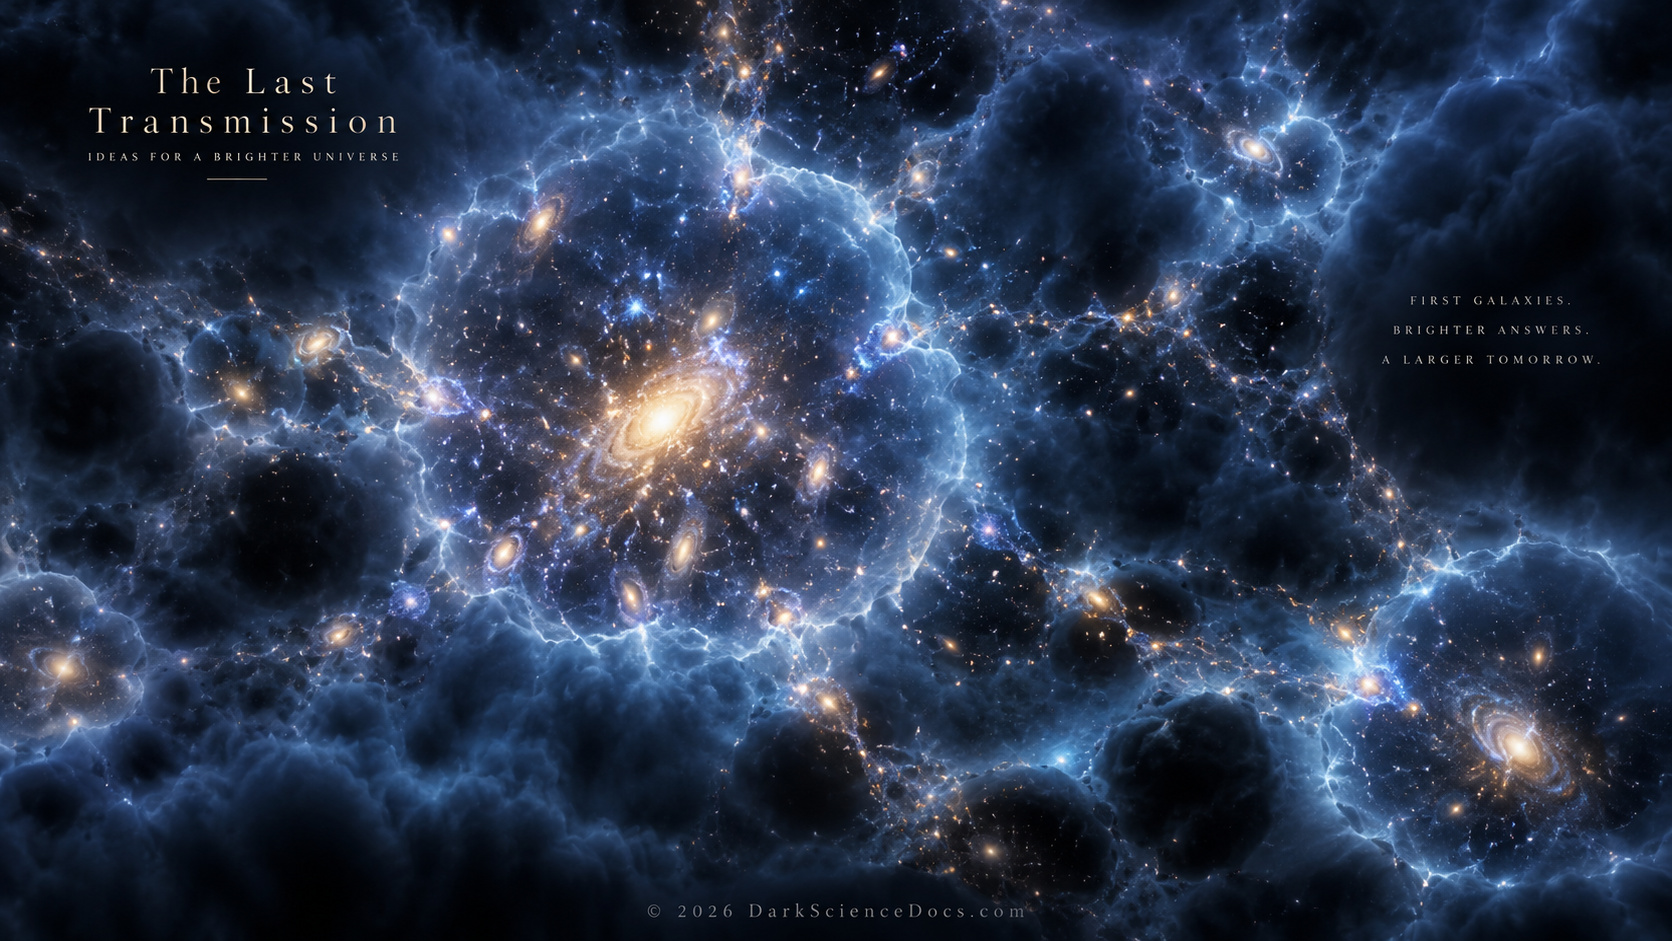
EVIDENCE FILE 06 / COSMIC DAWN
What Does Missing Light Tell Us About Cosmic Dawn?
A young galaxy emits light, but its hydrogen line may vanish on the way to us. Can that absence reveal the gas between galaxies?
All Evidence FilesTHE SHORT ANSWER
Astronomers observe light from distant galaxies and quasars, including how strongly the hydrogen Lyman-alpha line survives. Neutral hydrogen can scatter that line out of our sight. Simulations such as THESAN connect the galaxy, its surroundings, and the intergalactic gas to predict when a line should reach us. A weak or absent line is evidence to interpret, not a direct photograph of a neutral region or proof that a particular galaxy produced little light.
THE EVIDENCE MAP / COSMIC DAWN
Where did the first light go?
A spectrum records surviving light. A simulation follows routes it could have taken. Several different absorbers can dim the same line.
- 01Measurement
A hydrogen line fades
Spectra of very distant galaxies measure the strength or absence of Lyman-alpha emission, while other cosmic observations constrain the changing state of intergalactic hydrogen.
- 02Interpretation
Neutral gas can scatter it away
THESAN models show how the intergalactic medium and an uneven landscape of ionized regions could let the line escape along some sightlines and suppress it along others.
- 03Competing explanation
The galaxy can hide its own light
Dust, local gas, the emitted line profile, and shifts in velocity can also reduce observed Lyman-alpha. One faint or absent line does not isolate the neutral fraction outside the galaxy.
- 04Open test
Compare many spectra and probes
Measure other lines and systemic redshifts across larger galaxy samples, then compare their statistics with quasar absorption and microwave-background constraints under several reionization models.
OBSERVATION / INFERENCE / LIMIT
Read the signal.
Hydrogen-line visibility
Spectra show whether Lyman-alpha reaches us from distant sources.
Uneven transmission
THESAN predicts that different galaxies and sightlines can have different chances of escape.
One galaxy's surroundings
Dust, intrinsic emission, local gas, and intergalactic hydrogen overlap in the signal.
INSIDE THE EVIDENCE
The chain of reasoning.
Each step has a different level of certainty. Follow the measured result into the explanation, then see where the trail ends.
The light we receive is the last link
Lyman-alpha light is made when hydrogen atoms change energy state. A telescope receives only photons that survived their trip out of a galaxy and through material between that galaxy and us. Neutral hydrogen readily scatters photons near this wavelength, so a missing or weakened line can carry information about reionization. Yet the observation begins at the detector: a measured spectrum and its uncertainty. It does not show an ionized bubble with a bright edge drawn around the galaxy.
What THESAN contributes
THESAN combines models of galaxy formation, radiation transport, gas, and dust across a large simulated volume. Its researchers calculate how the Lyman-alpha line changes as photons move through a galaxy's environment and the intergalactic medium. The work finds large differences among sightlines, even for the same underlying galaxy. That makes the simulation a way to test interpretations of a survey, rather than an independent measurement of exactly what happened around any one real galaxy.
The alternatives inside a missing line
A galaxy can have little visible Lyman-alpha for several reasons. Dust can absorb light before it leaves, local gas can scatter it, and the emitted line may differ from the profile assumed by a model. Velocities shift the wavelength and change how strongly neutral gas intervenes. The THESAN analyses find that some unfavorable sightlines are affected by self-shielded systems and peculiar motions. Intergalactic neutral hydrogen matters, but a single non-detection cannot assign a unique fraction of neutral gas to one place.
Why a population is more useful
Researchers compare many galaxies across different distances, luminosities, and environments, rather than turning one faint line into a cosmic timeline. They can ask how the fraction of visible emitters changes and whether bright sources tend to occupy larger clear regions. Quasar absorption and the cosmic microwave background supply other constraints on reionization that respond to different parts of the history. Agreement across these probes is stronger than a picture based solely on one simulated bubble or one selected galaxy.
The next discriminating test
More complete spectra can constrain a galaxy's systemic redshift and other emission lines, helping separate intrinsic Lyman-alpha production from absorption along the route. Larger samples and several independent lines of sight can test whether the distribution of visible and hidden galaxies matches competing reionization models. Such comparisons must continue to account for dust, gas below the simulation's resolution, and selection effects. The goal is a defensible history of changing intergalactic hydrogen, not a date when the whole universe switched on at once.
THE EASY MISREADING
THESAN is a simulation, not a telescope image. A galaxy with no detected Lyman-alpha line does not, by itself, prove that its surrounding intergalactic gas was neutral.
PRIMARY RESEARCH & MISSION RECORDS
Check the source.
These are the studies and mission records behind this explainer. The illustrated article and Field Note continue the investigation.
EXPLORE IN 3D / MAP 13
Follow distant light into cosmic time
Use the Local Group as a point of departure before tracing how light from young galaxies reaches us.
Open Universe mapFOLLOW THE THREAD
Stay with the question.
Early galaxies made light, but neutral hydrogen could still keep much of it from traveling far. Reionization was a patchwork of openings, not a single cosmic sunrise.
Watch the related documentaryMORE EVIDENCE FILES
Keep looking.
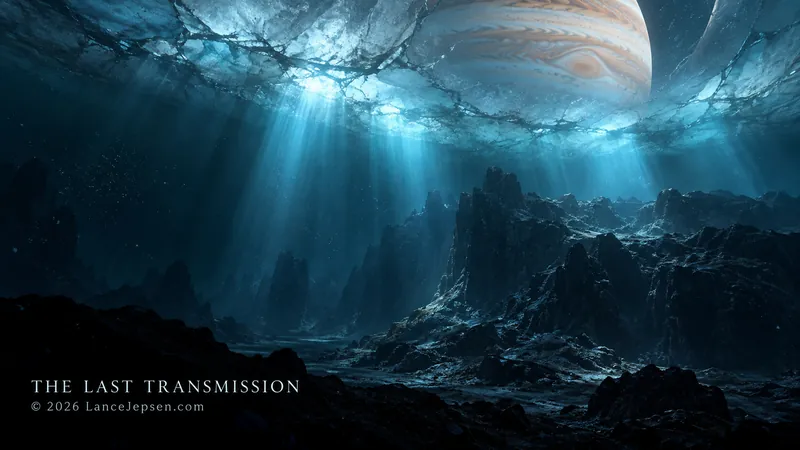
EVIDENCE FILE 01 / EUROPA
How Do We Know Europa Has an Ocean?
Galileo's magnetic measurements point to a conducting layer beneath Europa's ice. A salty ocean is the leading explanation. Its chemistry and seafloor activity remain open questions.
Read the evidence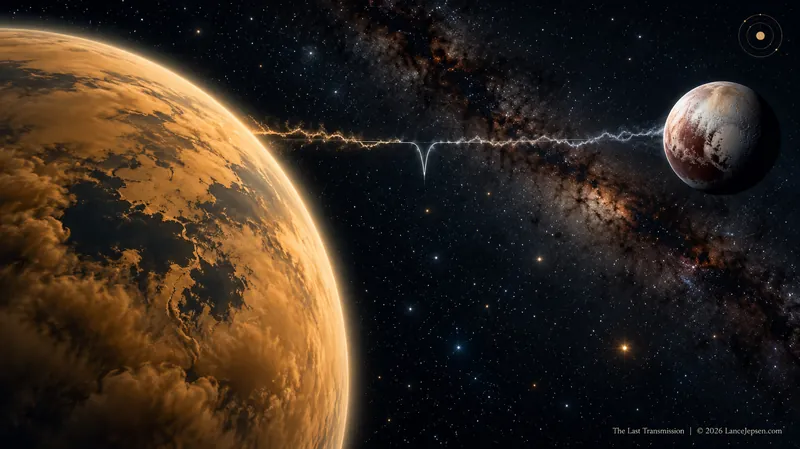
EVIDENCE FILE 02 / TITAN & PLUTO
What Is the 5.11-Micrometer Mark on Titan and Pluto?
The 5.11-micrometer absorption is measured on both worlds, but the Pluto feature is broader. A shared wavelength is a clue to investigate, not a chemical identification.
Read the evidence