
VISUAL ARCHIVE / IMAGE STORY
The Temperature Between Hot and Cold
Webb mapped intermediate-temperature gas using infrared emission from ionized neon.
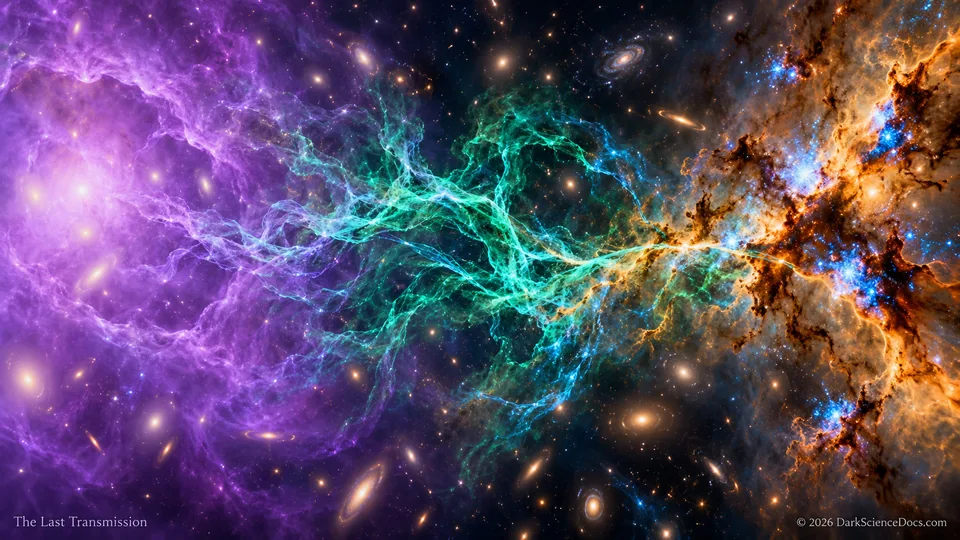
Webb mapped intermediate-temperature gas using infrared emission from ionized neon. This false-color illustration represents a cooling sequence; its colors are explanatory.
THE OBSERVATION
What we can actually see.
The research follows emission from ionized neon and other tracers into the cluster core. Different analyses estimate star formation over different averaging windows, with rates expressed as solar masses per year. An inferred cooling-flow rate describes gas moving through temperature ranges and is a separate quantity. Spatial relationships among cavities, cooling gas and young stars motivate a physical feedback interpretation.
THE ILLUSTRATION
What the artwork imagines.
Webb mapped intermediate-temperature gas using infrared emission from ionized neon. This false-color illustration represents a cooling sequence; its colors are explanatory. The viewpoint, illumination, colors and simultaneous arrangement are artistic choices. This is a cinematic illustration, not a direct instrument image or a quantitative reconstruction of every feature.
FROM THE ILLUSTRATED ARTICLE
The story that inspired it.
The Phoenix Cluster’s central galaxy forms stars amid powerful black-hole feedback. Infrared observations follow gas through an intermediate temperature range, making the competition between heating and condensation more visible. This frame focuses on the temperature between hot and cold, within the complete illustrated article and its source-linked research context.
Read The Black Hole That Couldn’t Stop the StarsCHECK THE RECORD
The image interprets the research below. Follow the original work for the measurements and limits behind the scene.
Directly Imaging the Cooling Flow in the Phoenix Cluster Cold Gas and Star Formation in the Phoenix Cluster with JWST Anatomy of a Cooling Flow: The Feedback Response to Pure Cooling in the Core of the Phoenix Cluster NASA/Chandra 2025-02-13 research accountOTHER IMAGE STORIES
Keep looking.
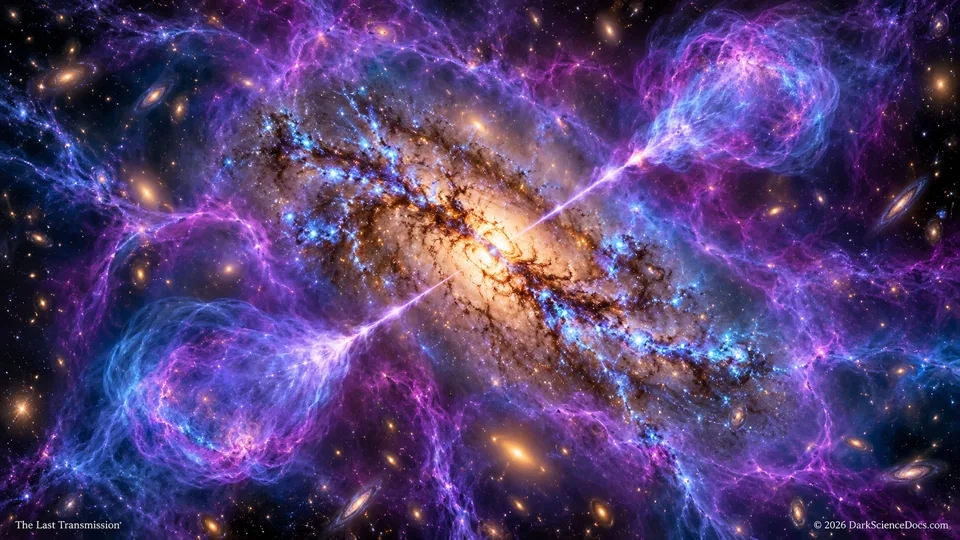 Stars Amid Phoenix’s Central Outburst
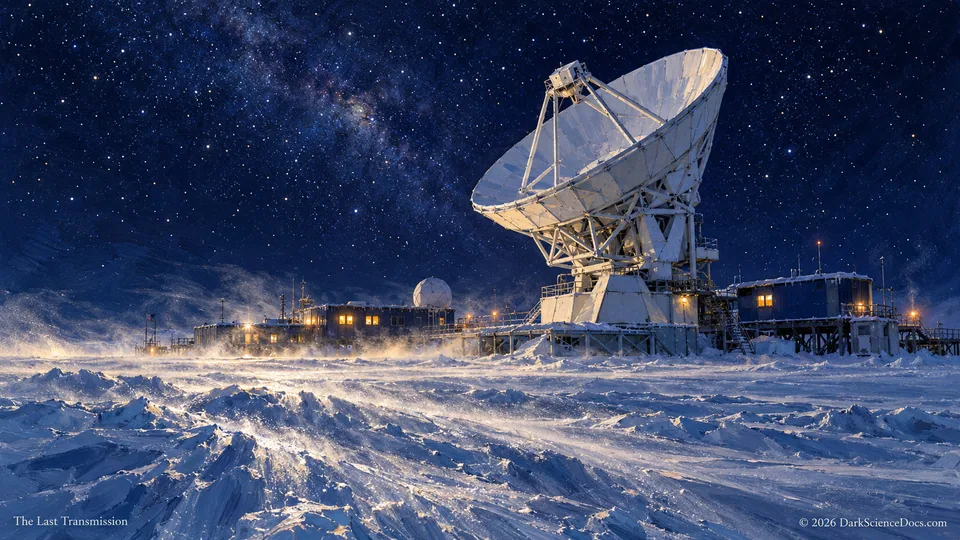 A Cluster Found from Antarctica
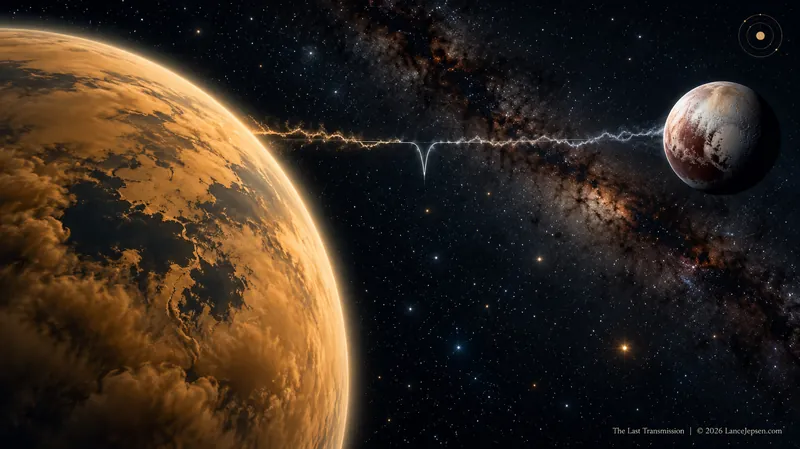 The Mark Shared by Titan and Pluto
EXPLORE IN 3D / MAP G-01
Explore a nearby black-hole teaching model
Use Sagittarius A* as a nearby comparison. The model is not a reconstruction of the Phoenix Cluster or a little red dot.
Open Sagittarius A* map