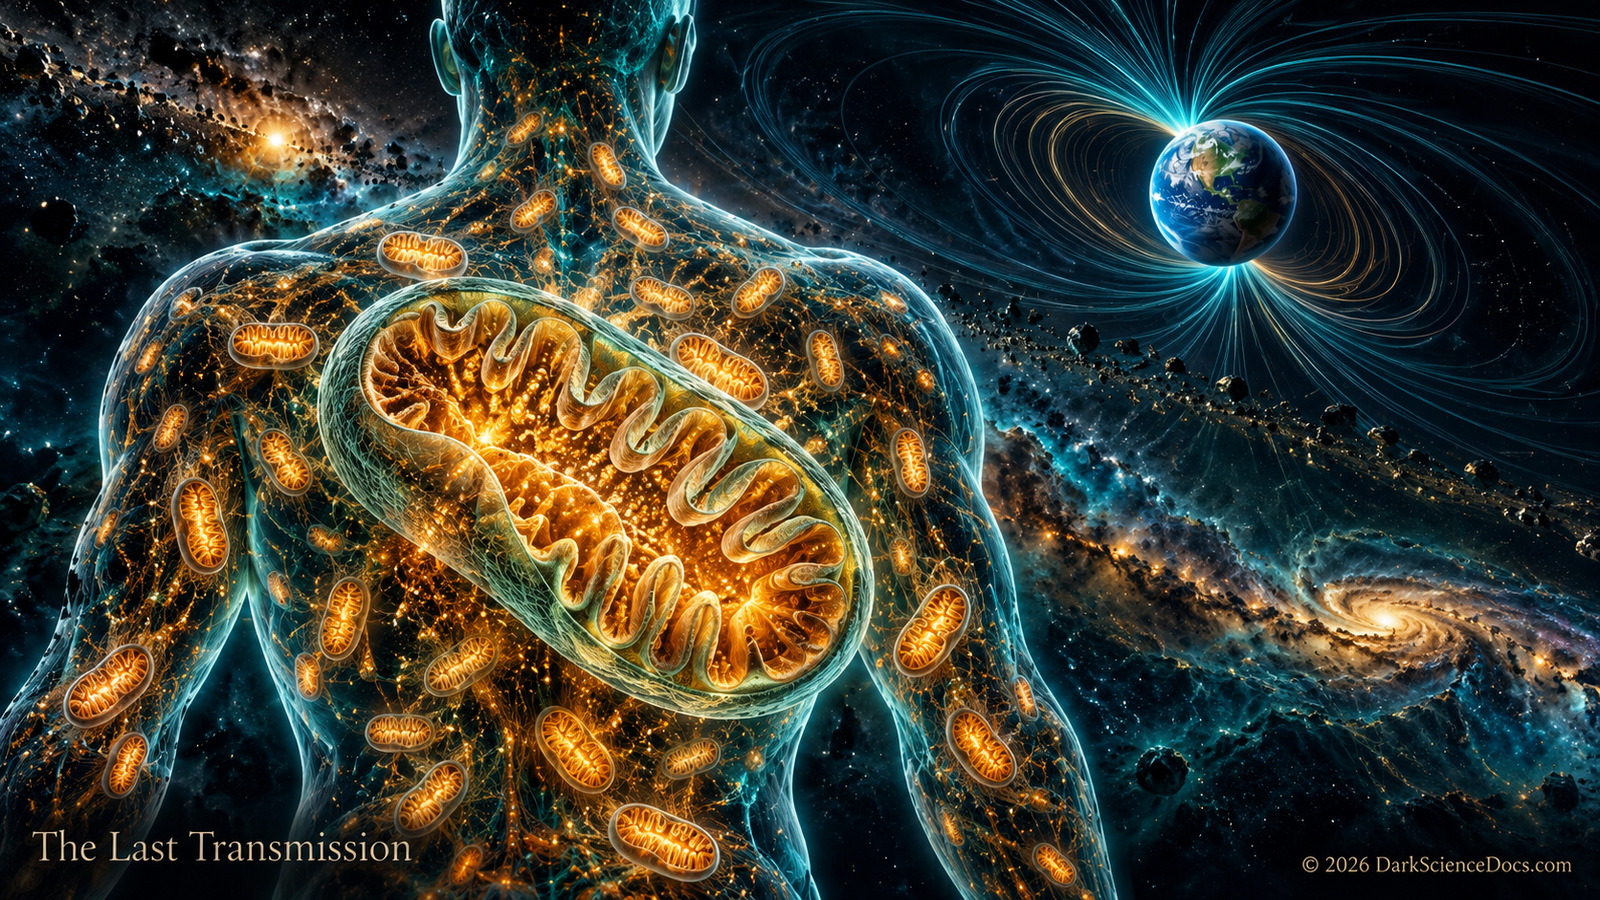
Enter the folded membrane and start its molecular machinery. Watch a gradient build, follow a rotating protein motor, and discover why a busy mitochondrion can still produce less ATP.
Relative teaching indices. Normal steady ATP production and electron transfer = 100. Not molecular counts or measured rates.
Choose a research file. Drag to rotate; pinch or use the zoom buttons.
OPERATE THE INNER ENGINE
Start the power flow. Watch electron transfers build a hydrogen-ion gradient, then follow the return path through ATP synthase.
FILE 01 / MITOCHONDRION
Power the Cell
A working inner engine / try the controls
Can a busy mitochondrion still make less ATP?
Enter an opened patch of the inner membrane. Yellow signals trace electron transfers between respiratory complexes; blue hydrogen ions cross the membrane and return through ATP synthase. Hydrogen ions cross through the membrane motor, rather than down its shaft. The rotating c-ring and central shaft drive changes in the fixed catalytic head, where ADP and phosphate become ATP.
TRY THE CONTRAST
Fast electron transfer. Less ATP?
Start the flow, then reduce oxygen. Restore the engine and open a proton leak. Compare the two readouts: a faster electron-transfer chain does not always mean more ATP.
Trace the electron-transfer route
This scene follows electrons supplied by NADH: complex I, the membrane carrier Q, complex III, cytochrome c, then complex IV. Oxygen accepts electrons at the end of the chain and water forms. Complex II provides a separate entry through Q; that route is not drawn here.
Above the membrane: intermembrane space. Below the membrane: matrix, where the ATP-making head sits.
An outer membrane encloses the mitochondrion. A separate inner membrane surrounds its matrix and folds inward into cristae. The narrow space between the membranes matters because it can hold a different concentration of hydrogen ions from the matrix. The open front and luminous edges in this model reveal hidden surfaces; they are a cutaway, not a real rupture.
Cristae are folds of the inner mitochondrial membrane. Their geometry increases membrane area available for the protein complexes involved in respiration and ATP production. Real cristae are much more intricate and variable than the illustrated folds shown here. The ribbons symbolize folds of one continuous membrane, not separate organelles; their connections are simplified.
The electron transport chain in the inner membrane transfers energy from electron carriers to pump hydrogen ions from the matrix toward the intermembrane space. This establishes an electrochemical gradient across the inner membrane. The anatomy view marks the side of that boundary with blue points. In Power the Cell, separate blue paths show pumping and return flow; yellow signals follow electron transfers. These colors and paths are enlarged teaching symbols.
Hydrogen ions flow back toward the matrix through ATP synthase in the inner membrane. That enzyme couples the flow to ATP production from ADP and phosphate. The anatomy marker shows its location. Choose Power the Cell, then Molecular motor, to explore the rotating c-ring and central shaft within the fixed catalytic head. ADP and phosphate symbols approach the head and ATP symbols leave it; rates and conformational changes are illustrative.
Mitochondria retain DNA and depend on many proteins encoded in the cell nucleus. Comparisons of genetic and cellular machinery support their descent from a bacterial endosymbiont. The glowing loop is only a symbol for mitochondrial DNA, not the number, position, or packaged structure of genomes in any particular organelle. The broad ancestry is well supported; details of early eukaryotic evolution remain debated.
Why does a mitochondrion not always look like a bean?
Step back from the cutaway into an illustrated cell. Yellow tubules branch and flex around a blue nucleus, with red supporting fibers behind them. In many cells, mitochondria form changing networks rather than a collection of isolated bean shapes. Real networks remodel through movement, division (fission), and joining (fusion). Shape and connectivity vary with cell type and condition. Pause the movement, rotate the cell, or hide its context to study the strands.
READ THE IMAGE
The fluorescence-style colors identify structures; they are not their natural colors. This original illustration is inspired by microscopy. Its gently flexing graph keeps the same connections: it does not show measured motion, simulated fission or fusion, or one reconstructed cell. Crossings seen from one angle are not necessarily junctions.
Return to the eukaryotic cell to see this structure in context, then follow a separate origin investigation into the earlier bacterial and archaeal lineages.
This is a teaching cutaway, not a live microscopic scan or a reconstruction of a whole mitochondrion. The protein surfaces are simplified from published structures: human complex I (5XTD), bovine complex III (1BGY), bovine complex IV (1OCC), and bovine ATP synthase (5ARE). These are separate structural examples arranged for teaching, not one measured assembly. The membrane and small carrier symbols are illustrated; colors, spacing, surface detail, and motion are interpretive. The outer and inner membranes, folds, and molecular machinery are enlarged or opened so each question is visible. The particles do not show measured concentrations. Power the Cell uses a simplified gradient balance: electron transfers supply pumping, ATP synthase provides one return route, and an adjustable leak provides another. Reduced oxygen restricts electron transfer; a proton leak can increase electron transfer while lowering ATP output. ATP production outside mitochondria, reverse ATP synthase operation, regulation, and cellular damage are not modeled. Shapes, animation speeds, control percentages, and indices are illustrative. The DNA loop is symbolic. Colors and relative positions are editorial choices, and mitochondrial shapes vary among cells.
Compare black-hole horizons, calculate a signal’s travel time, and zoom from a cell toward an atom. Every tool shows its working and the assumptions behind its answer.
Structure, energy transfer, and ancestry use different records.
Microscopy, molecular studies, and genetic comparisons contribute distinct evidence about mitochondria. The animations bring those ideas into one view, but motion on the screen is not a measurement. Ask which method supports each structure, mechanism, or ancestry claim.
Ask yourself Do these sources contain separate measurements, or are they retelling the same result?
THE SIGNAL CONTINUES
Some discoveries stay with you.
Get the illustrated investigations delivered to your inbox. Then follow the questions that refuse to leave.