
EVIDENCE FILE 18 / STELLAR LIGHT
What Does Tabby’s Star’s Light Curve Actually Reveal?
The brightness really changed. What can the shape of a dip tell us, and which questions require a different observation?
THE SHORT ANSWER
Kepler recorded large, irregular changes in the light received from KIC 8462852, better known as Tabby’s Star. A light curve preserves their timing, depth, and shape. It does not identify the material responsible. Later observations in several colors provided a different test: wavelength-dependent dimming in the observed 2017 dips favored optically thin dust over a simple opaque screen, while some intrinsic stellar explanations remained possible. The two Kepler excerpts below are original plots of archived measurements. They let you examine the signal directly without treating an attractive explanation as a second observation.
THE EVIDENCE MAP / STELLAR LIGHT
From a brightness dip to a testable explanation
The Kepler signal supplies timing and shape. A different observation is needed to test wavelength dependence and narrow the possible causes.
- 01Measurement
Light received at the detector
Kepler archived time-stamped broadband flux and reported sample uncertainties. The data view below preserves selected measured samples, their errors, and the gaps in the record.
- 02Interpretation
Depth and timing constrain a model
The brightness drops and recovers with a measurable shape. Comparing that shape with a model can constrain its parameters, but the curve alone does not identify an obscuring material.
- 03Competing explanation
Ask what would differ in color
An opaque screen and small, optically thin dust make different predictions for wavelength-dependent dimming. Follow-up in several filters tests a distinction unavailable in this broadband plot.
- 04Open test
Connect each claim to its observation
Compare simultaneous colors, spectra, and repeated events while preserving calibration and uncertainties. A result for one set of dips must not silently become a conclusion about every timescale.
OBSERVATION / INFERENCE / LIMIT
Read the signal.
Brightness over time
NASA Kepler long-cadence photometry of KIC 8462852, archived at MAST.
Two selected episodes
Quarter 8 and quarter 16 excerpts from Data Release 25. These are not the complete four-year record.
Dimming in different colors
Published 2017 follow-up observations constrain some proposed causes; they are not color measurements made by this Kepler plot.
INSIDE THE DATA / KEPLER’S OBSERVATIONS
Read the dip.
Keep the cause open.
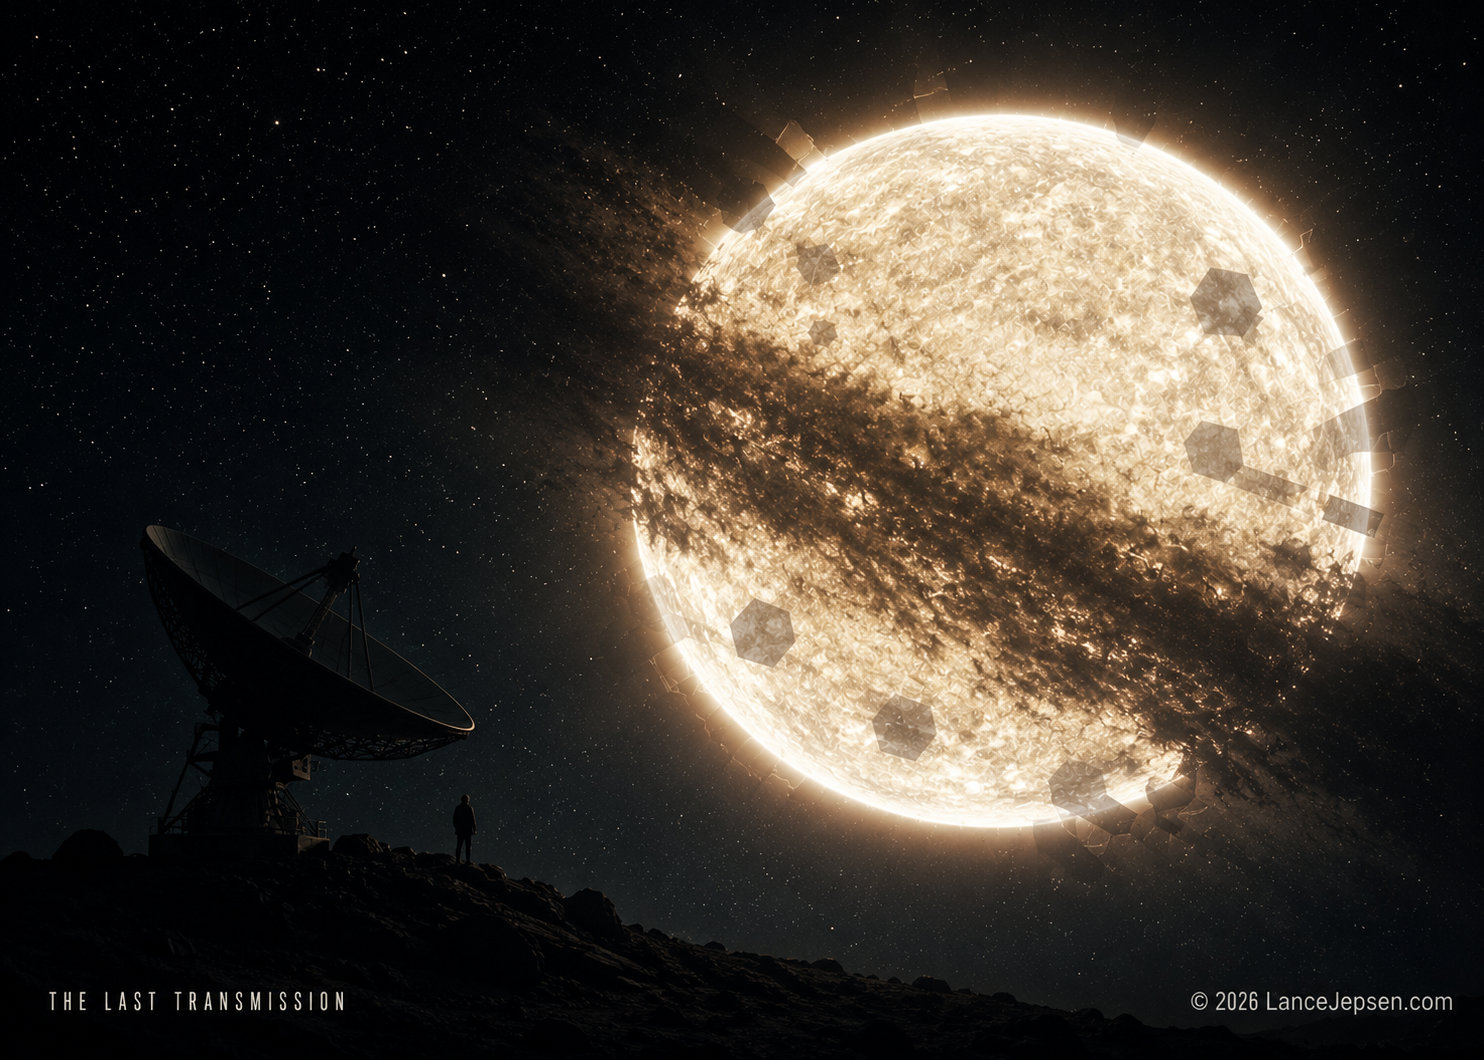
Actual measurements from NASA Kepler, with our original plotting and explanation. Choose an episode, inspect a sample, and follow the method back to the archived file. The artwork above illustrates the story; these plotted points come from spacecraft photometry.
D800 / a single deep dip
Quarter 8 · 674 retained samples · same 70–101% brightness scale in both views
Click or tap the plot to select the nearest measurement in time. The slider also works with arrow keys. Selection snaps to observed samples, including near a gap.
D1500 / the early complex
Quarter 16 · 799 retained samples · same 70–101% brightness scale in both views
Click or tap the plot to select the nearest measurement in time. The slider also works with arrow keys. Selection snaps to observed samples, including near a gap.
A change in received light.
Depth, duration, and the changing shape are measurable constraints. In these specific normalized excerpts, the deepest samples are 14.5% and 20.9% below the reference. These values describe our selected DR25 samples and baseline choices. They do not replace the full-mission maxima discussed in the original paper.
A shape does not name a cause.
A broadband dip alone cannot identify composition or uniquely reconstruct the intervening geometry. These excerpts also cannot test long-term repetition. The later wavelength-dependent dips supplied separate evidence about some proposed causes. Read the 2017 color test and its limits ↗.
Precision has a scope.
The displayed error is the mission’s reported 1σ uncertainty for a sample, divided by the same fixed baseline. It does not include uncertainty in our median reference, correlations between samples, or every instrumental systematic. Small bars establish precise photometry under that processing; they do not make a proposed cause equally certain.
How we prepared the display, with exact reference windows
PDCSAP_FLUX and PDCSAP_FLUX_ERR divided by the median flux in stated baseline windows, then multiplied by 100. Keep finite positive-error rows with SAP_QUALITY = 0. No binning, smoothing, fitting, interpolation, or uncertainty inflation. The normalization denominator is held fixed; its uncertainty and correlated instrumental errors are not included in the displayed pipeline errors.
- Quarter 8: displayed time 785–801; median reference from 785–787 and 798–801 (216 retained samples), 259990.234375 electrons per second.
- Quarter 16: displayed time 1508–1528; median reference from 1490–1500 (430 retained samples), 248807.351563 electrons per second.
Time is barycentric Julian date in the TDB time scale, minus 2,454,833 days. Barycentric correction accounts for the observer’s motion relative to the solar system’s center of mass. The strict SAP_QUALITY = 0 filter is our editorial extraction choice and can discard otherwise usable samples. This is an original educational view of the archive, not a reproduction of the authors’ full analysis.
Credit: NASA Kepler mission; MAST at STScI. Data Release 25, FITS version 6.1; retrieved October 11, 2026. Archive column definitions ↗ · Boyajian et al., original Kepler analysis ↗.
INSIDE THE EVIDENCE
The chain of reasoning.
Each step has a different level of certainty. Follow the measured result into the explanation, then see where the trail ends.
Start with the quantity the instrument recorded
A light curve is a time series of received brightness. Its horizontal coordinate says when a measurement was taken; its vertical coordinate says how much light reached the detector relative to a chosen reference. In the viewer, selecting a sample exposes both numbers and the archive’s reported measurement error. This gives readers a way to check a statement such as ‘the star dimmed sharply’ against observations. The detector did not record the name, composition, or purpose of whatever caused that change.
Kepler Archive Manual: light-curve columns and time systemThe display has choices you should be able to inspect
We use the mission’s corrected PDCSAP flux, select cadences with no quality flags, and divide by the median brightness in explicitly listed reference windows. That operation makes the reference 100 percent. It neither fits a transit nor reconstructs missing observations. The source files and extracted tables remain downloadable. Different baseline choices can shift a reported percentage, and a strict flag filter can omit usable observations. Reading the method alongside the chart helps keep those display choices visible instead of mistaking them for properties measured independently.
MAST: Kepler mission archiveA shape is a constraint on an explanation
Try the first episode, then switch to the early part of the later complex. Ask whether a proposed explanation could produce the timing and depth of the samples in each view. Shape can help constrain a model, but an irregular curve does not provide a unique physical reconstruction. Many combinations of geometry and changing opacity can alter received light. These short excerpts also cannot establish whether a pattern repeats across the entire mission. That question requires the longer record and a stated search procedure.
Boyajian et al.: Planet Hunters X, the original Kepler analysisWhy measuring different colors mattered
The plotted Kepler signal is broadband brightness. The 2017 follow-up instead compared dimming through different filters. Those dips changed with wavelength, which challenged models relying on optically thick obscuring material and supported a contribution from small, optically thin dust. The authors also allowed some variations intrinsic to the stellar photosphere. Keep that test attached to the observations that performed it: these older Kepler samples cannot supply the missing color information, and the follow-up did not establish one explanation for every timescale of dimming.
Boyajian et al. 2018: first post-Kepler dips and their limitsKeep the next test separate from the story
A useful next observation should distinguish possibilities that the present record leaves open. It might compare simultaneous colors, spectra, or repeated events rather than simply collect another evocative image. Before accepting a proposed cause, ask what signal it predicts and whether that signal has actually been measured. The purpose of this file is to make that distinction inspectable. Replotting archived samples checks how an explanation relates to those data; it does not repeat the original observing campaign or turn our editorial annotations into experimental evidence.
The follow-up study’s multiband measurements and unresolved questionsTHE EASY MISREADING
A dip is evidence of a change in received brightness. Its unusual appearance alone does not establish dust composition, an alien structure, or one cause for all of the star’s variability.
PRIMARY RESEARCH & MISSION RECORDS
Check the source.
These are the studies and mission records behind this explainer. The illustrated article and related research pages continue the investigation.
FOLLOW THE THREAD
Stay with the question.
Continue into the color test, watch the documentary, or return to the illustrated article. The plotted record and the proposed cause remain separate parts of the investigation.
MORE EVIDENCE FILES
Keep looking.
EVIDENCE FILE 05 / COSMOLOGY
Why Do Two Measurements of Cosmic Expansion Disagree?
Planck's early-universe data imply an expansion rate near 67.4 under the standard cosmological model; the SH0ES distance ladder finds about 73.0. The discrepancy is real in those analyses, but its cause is unresolved.
Inside the Data →
EVIDENCE FILE 12 / STELLAR LIFE CYCLES
How Do We Know the Life Cycle of a Star?
Read the evidence behind stellar evolution: measured starlight, cluster ages, binary companions, and the remnants of collapse. Follow the observations into the models, then explore stellar fates and black-hole gravity in 3D.
Read the evidence