
EVIDENCE FILE 47 / OBSERVATION & INFERENCE
What Does Webb’s Unidentified 1.60-Micrometer Line Establish?
Trace the repeated spectral detection, missing companion lines and noncontemporaneous imaging before considering possible identities for the source.
THE SHORT ANSWER
What does the evidence support?
The study reports a consistent emission feature in multiple observing configurations and at two epochs. It establishes a spectral puzzle with strong constraints. A unique line identification, secure redshift and physical source class remain unresolved, and the comparison image was taken roughly a year before the spectral detections.
MEASUREMENT / INTERPRETATION / LIMIT
Follow the chain of reasoning.
01 / 04
The feature survives geometric checks
Measured or modeled
NIRSpec observations detect the line in multiple dither positions and in two telescope orientations.
What it suggests
Consistency across those configurations supports an astronomical feature rather than a one-exposure artifact tied to one detector position.
Where the claim stops
These checks support the reported detection; they do not determine the emitting species, redshift or complete physical history of its source.
Huberty et al. (2026): full single-line emitter study and observation dates02 / 04
The observed wavelength admits alternatives
Measured or modeled
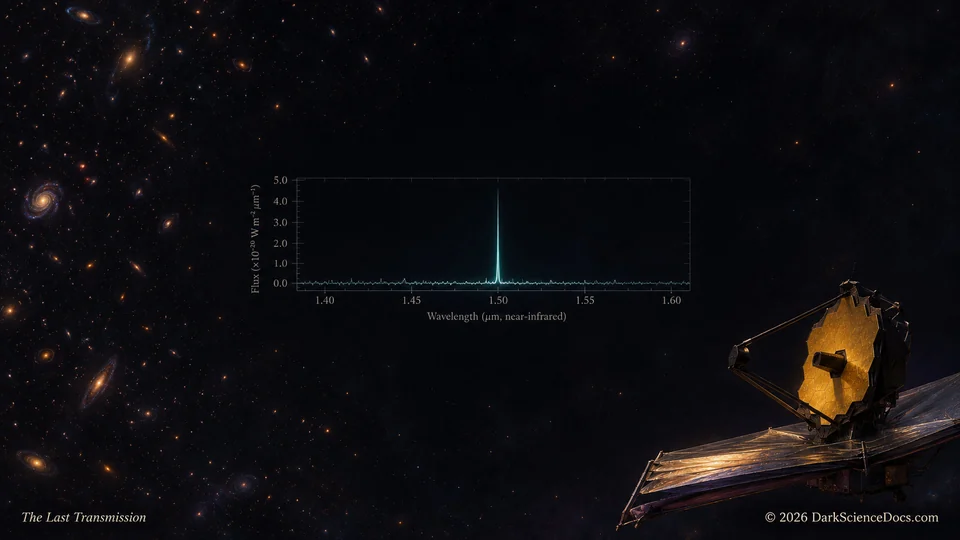
The emission peaks near 1.60 micrometers, while clearly identified companion lines are absent within the available constraints.
What it suggests
Different proposed transitions would place the source at different redshifts and predict different accompanying features.
Where the claim stops
A single wavelength cannot securely choose among the discussed galaxy, active-nucleus and transient possibilities without further evidence.
Published paper: A Single Line Emitter Identified in an Unbiased Search with JWST/NIRSpec03 / 04
The imaging limit comes from another epoch
Measured or modeled
The JADES comparison image was acquired October 8–10, 2022; the spectroscopy was obtained August 23 and November 19, 2023.
What it suggests
A source could change between the earlier image and the line detections, making a time-dependent explanation worth testing.
Where the claim stops
The non-detection is not simultaneous proof that the line had no continuum source at the moment it was observed.
Huberty et al. (2026): full single-line emitter study and observation dates04 / 04
Two spectral epochs constrain change
Measured or modeled
The line appears in orientations observed about 88 days apart, with measurements that can be compared across those epochs.
What it suggests
Persistence across the interval constrains possible transient histories and helps define an appropriate monitoring strategy.
Where the claim stops
Persistence over those dates does not establish permanent activity or exclude every slowly evolving transient or active-galaxy scenario.
Huberty et al. (2026): full single-line emitter study and observation datesMETHOD / INDEPENDENT TESTS
What would make the case stronger?
Put every observation on a dated timeline before combining it with another. An imaging limit can strongly constrain a steady source while leaving more freedom for an object that changes between epochs.
For each proposed line identification, list the redshift it implies and the other features that should accompany it. Compare those predictions with the instrument’s wavelength coverage and sensitivity, keeping an unmeasured quantity distinct from a meaningful upper limit.
Further spectroscopy that detects companion lines, imaging obtained close in time to those spectra and monitoring of the line’s behavior could distinguish a distant galaxy, an active source and the transient explanations considered by the paper.