

64 / The ocean moves the climate
The Atlantic Heat Engine: What a Slowing AMOC Could Change
The Atlantic carries warmth into colder latitudes and returns water through its depths. Reading the warning in that circulation means following the instruments, the competing analyses, and the regional consequences of a slowdown.
Far beneath the familiar surface of the Atlantic, water carries a history of cooling, salt, and movement. The overturning circulation connects that hidden motion to heat exchanged with the atmosphere and conditions far beyond the sea. Its future matters because societies and ecosystems have adapted to the climate they know. The difficult part is recognizing a lasting change inside a system that also varies naturally. Our AMOC documentary opens that question; this investigation follows the distinction between recording a change, explaining its cause, and projecting what may happen next. Each step asks something different of the evidence.
A circulation with a surface and a hidden return
Warm upper-ocean water moves north while colder water returns at depth, connecting distant regions through a three-dimensional circulation. The Gulf Stream contributes to the Atlantic system, but its wind-driven circulation and the basin-wide overturning are different measures. That distinction changes what a claim of weakening means. Before picturing a current switched off, ask whether a study measures a boundary flow, deep transport, or the combined overturning through a particular Atlantic section.
NOAA: observing the AMOC and its boundary currentsWhy the record needs another decade
The National Oceanography Centre emphasized continued observation when it released its twenty-year RAPID update in September 2025. Its reported weakening trend carried a substantial uncertainty, and the team called for observations through at least 2034 to better distinguish natural variability from human influence. The extra years are an experiment in patience with a clear purpose. They can reveal whether a persistent change becomes easier to detect as the record grows, or whether a selected interval has exaggerated the impression of a one-way journey.
NOC: twenty years of RAPID observationsThe risk does not have one deadline
The IPCC assessment projects weakening across the considered emissions scenarios and assigns medium confidence to no abrupt collapse before 2100. That framing matters: evidence for a future slowdown can be stronger than confidence about a particular threshold. An investigation should keep the questions visible together rather than turn uncertainty into either dismissal or a precise countdown. The regional changes associated with weaker heat transport deserve attention even when the probability of an abrupt transition is difficult to quantify.
IPCC AR6: AMOC projections and confidenceFollow the Atlantic farther north
RAPID is one observing section in a much larger ocean. OSNAP follows heat, mass, and freshwater transport across the subpolar North Atlantic, with legs west and east of Greenland. Comparing records at different latitudes can show how a local signal relates to changes elsewhere in the basin. The next useful evidence would bring measurements and simulations into closer agreement about the processes involved. That is why the strongest version of this story returns to working instruments and openly available records.
OSNAP: a subpolar measure of the AMOCThe full investigation continues with the evidence, illustrations, and sources at The Last Transmission on Substack.
Continue reading on SubstackTHE EVIDENCE / THE OPEN QUESTION
What we know.
Continuous observations have transformed the AMOC from occasional ocean snapshots into a transport record. Research estimates depend on the interval and treatment of its components, and those choices can be checked against published methods and data.
What remains open.
The share of measured change attributable to human influence, the future scale of weakening, and the likelihood and timing of an abrupt collapse remain different questions. A transport trend cannot answer all three by itself.
Why it matters.
Climate consequences can develop while the circulation continues flowing. The value of following this story is understanding how measurements become evidence for changes in regional weather, sea level, and ocean conditions.
WATCH THE DOCUMENTARY
The Ocean Current That Keeps Europe Alive Is Weakening Faster Than Expected
The Atlantic overturning circulation moves heat, salt, and carbon. Its measured changes matter, even when forecasts of a complete collapse remain uncertain.
GO DEEPER / EVIDENCE FILE
Is the AMOC Weakening? How Scientists Measure the Atlantic
Follow the RAPID measurements, the sensitivity of estimated trends, and the distinction between observed weakening and projected collapse of the Atlantic overturning circulation.
FOLLOW THE EVIDENCE
Research behind the field note.
EXPLORE IN 3D / ATLAS H-01
Explore the ocean beneath the surface
Descend through sunlit water and deep habitats in the Ocean Atlas, then return to the Atlantic circulation record. The illustrated descent shows environments and energy sources; its water movement does not simulate the AMOC.
Explore Ocean Descent in 3DFOLLOW THE THREAD
Related signals.

They Grew a Human Cortex Inside a Mouse. Then They Tested Its Memory.
Scientists created mice whose cortical tissue was almost entirely derived from human cells. The tissue grew, formed connections, generated electrical activity, and revealed something extraordinary.
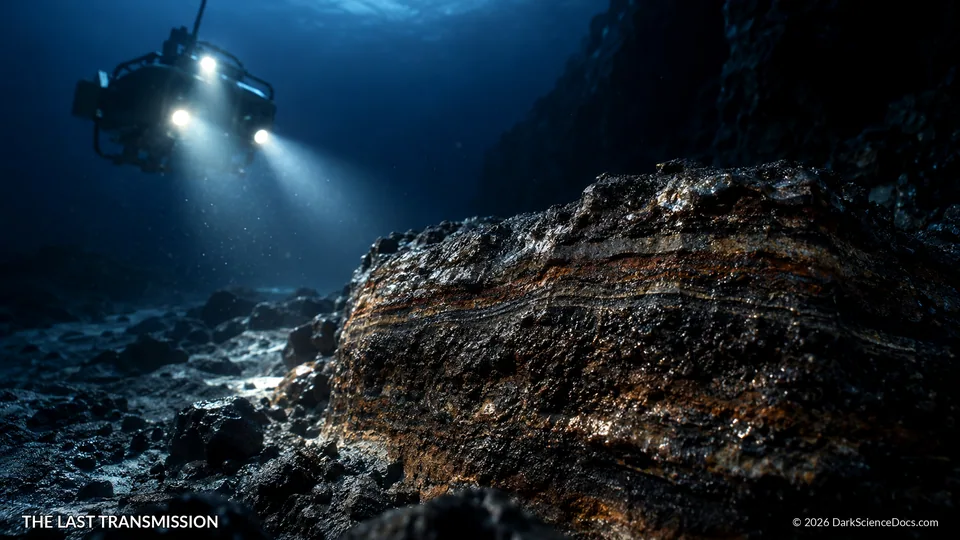
They Found Plutonium at the Bottom of the Pacific. The Explosion That Made It May Be Over 95 Million Years Old.
Deep beneath the ocean, scientists discovered radioactive debris from beyond Earth. The most disturbing clue was an element they could not find.

The Blows That Nearly Killed Earth May Have Helped Bring It to Life
A model identifies a window for life’s chemistry 4.33 billion years ago. The unsettling question is whether Earth was the only world to take advantage of it.