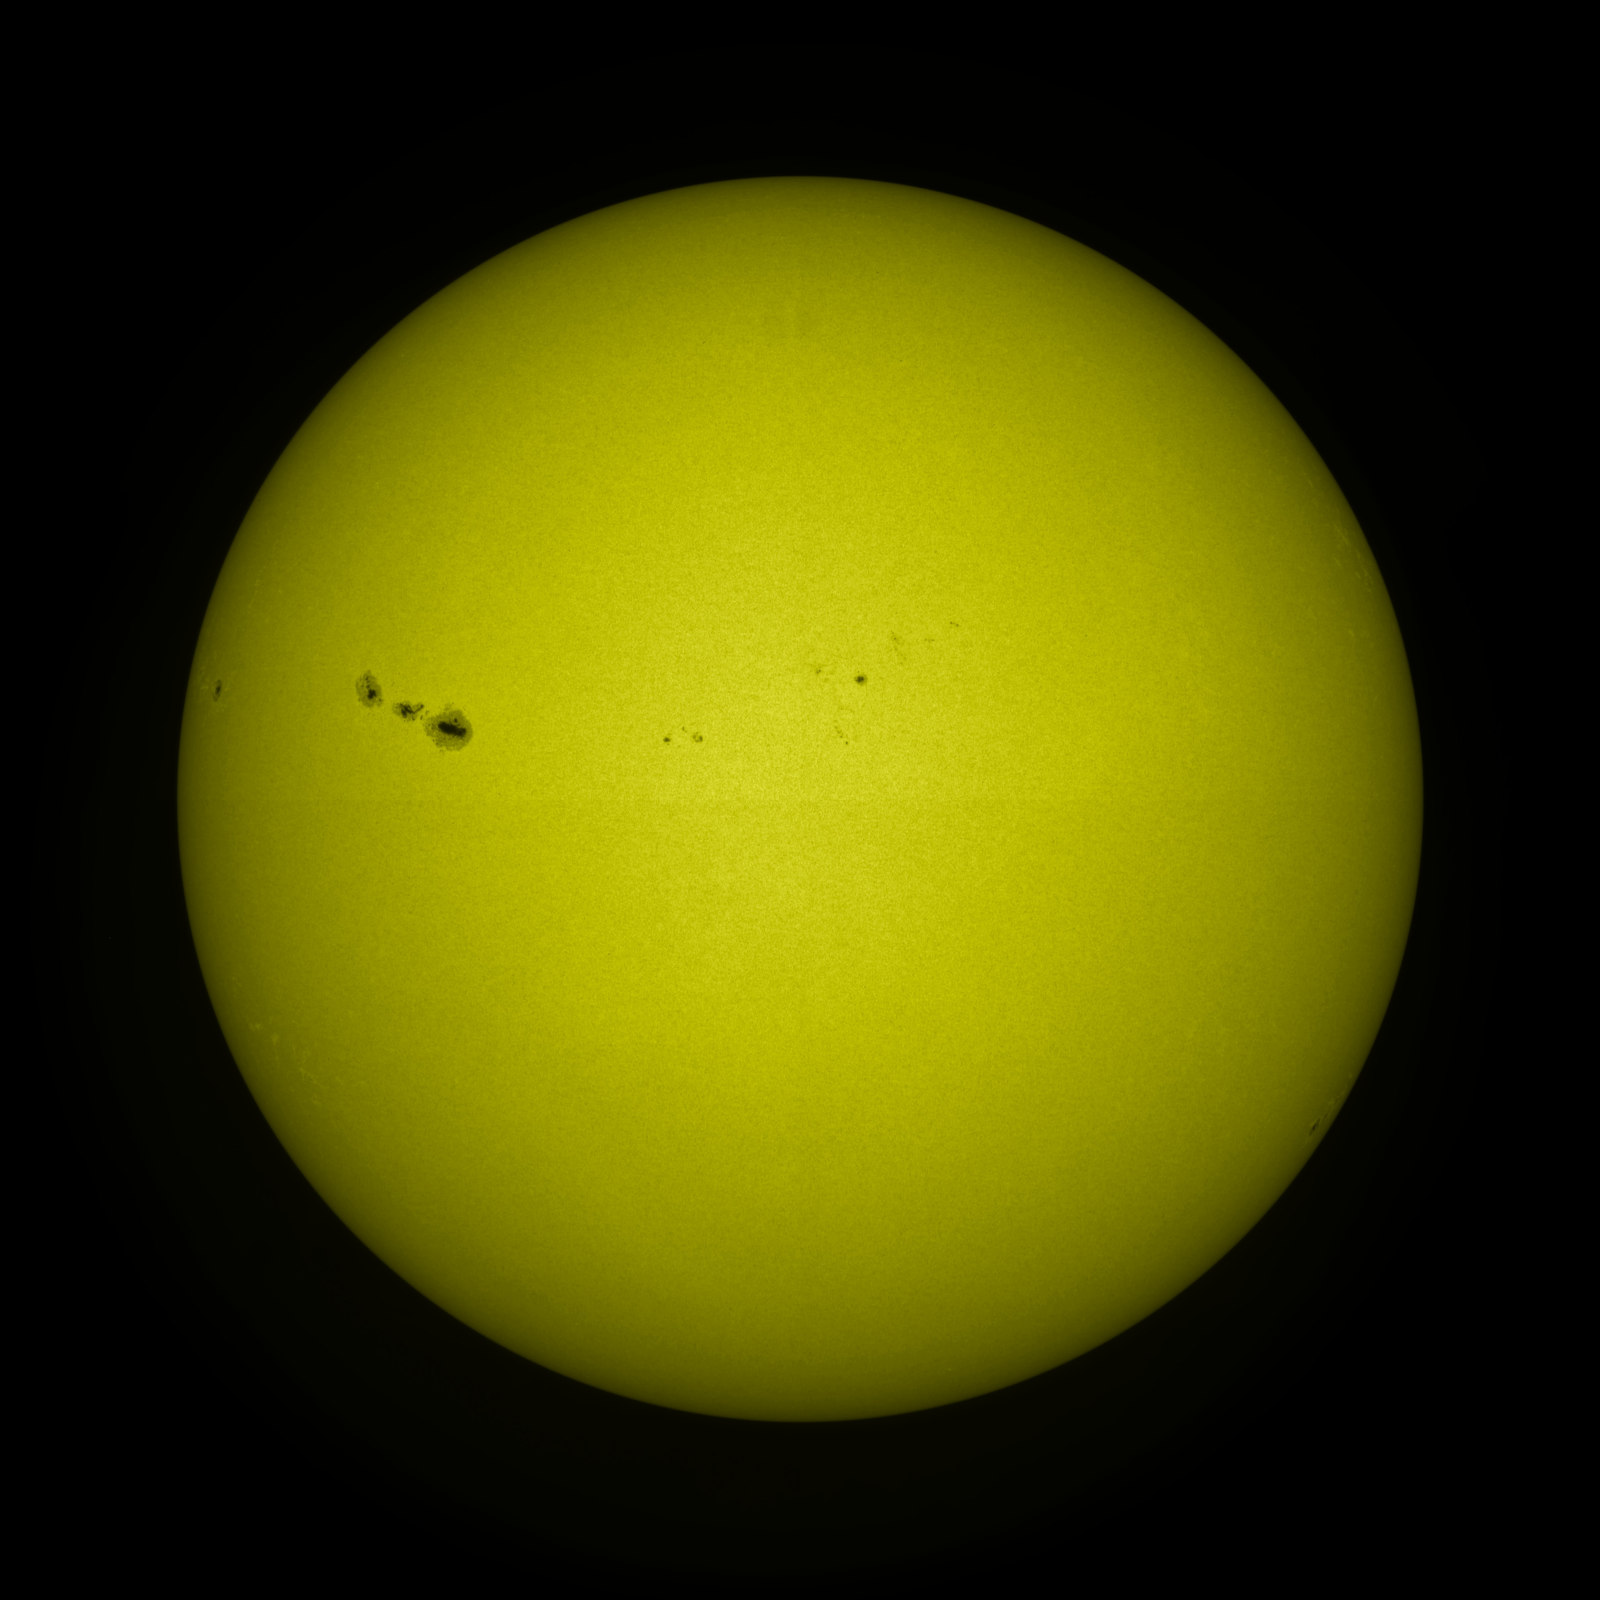
One star, two ways of seeing it. Move closer to an archival solar observation, switch wavelengths, and follow what the light reveals.
SOLAR OBSERVATORY / 03 ARCHIVAL SDO VIEW · SEPT 2011
VISIBLE LIGHT / 450 NM
Select a solar file or compare the two archival views.
DESTINATION 01 / SOLAR OBSERVATORY
Photosphere
Sunspots in motion
What can a dark sunspot tell us?
This 450 nm visible-light time-lapse from NASA’s Solar Dynamics Observatory follows a real sunspot group across the photosphere. The dark patches are cooler than their surroundings because strong magnetic fields suppress some convection, but they remain extremely hot. The 12-second loop condenses roughly fourteen hours; zoom toward the cluster to see its shape change.
What appears when visible light gives way to extreme ultraviolet?
At 17.1 nm, SDO records emission associated with hot coronal plasma. Bright arcs trace magnetic structures above the photosphere. This 12-second loop condenses roughly fourteen hours of archival observation, so the motion is accelerated. Gold encodes invisible extreme-ultraviolet light; it is not how human eyes would see the Sun.
How can a spacecraft investigate the atmosphere of a star?
Parker Solar Probe samples particles, fields, and plasma close to the Sun. Its in-situ measurements help explain how the corona is heated and how the solar wind accelerates. The SDO disk here is a separate archival observation, not a view from Parker.
Solar activity can send energetic particles and magnetized plasma into interplanetary space. Earth’s magnetic environment can respond with auroras and disruption to technology. A bright patch in this still image is not itself a forecast of an Earth-directed storm.
These fixed-disk observations were recorded by NASA’s Solar Dynamics Observatory during September 25–26, 2011. Each 12-second loop condenses roughly fourteen hours of its wavelength’s imagery. The sunspots and their slow changes are recorded observations, shown at an accelerated rate. These archival views do not depict current solar activity or real-time motion. The 3D scene adds depth and camera movement, without inventing the far side or Parker’s flight path. Gold is a visual encoding of invisible ultraviolet light. The visible-light loop loads when the map enters view; the ultraviolet loop loads only when selected. Both pause when you leave the scene.
Imagery and credit: SDO 450 nm visible-light photosphere and SDO 17.1 nm extreme-ultraviolet corona, NASA/Goddard Scientific Visualization Studio, SDO Science Team, and Virtual Solar Observatory. The still frames are resized for the web, and the two silent loops are compressed from NASA’s corresponding original movies.
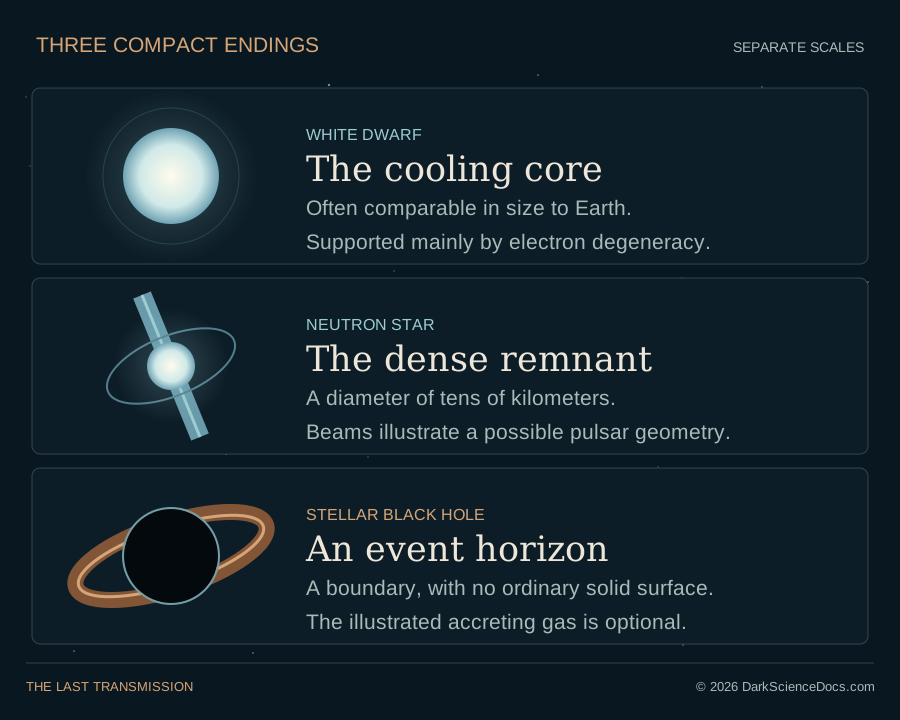
Follow single stars and interacting companions into white dwarfs, neutron stars and black holes. Compare the physics of the endings with the observations that let us reconstruct a stellar life.
Recorded sunlight and an illustrated interior have different roles.
Surface and corona imagery preserve observations from particular instruments and times. The interior account explains energy transport using physical models. Compare what the image directly records with what is inferred about the regions it cannot show.
Ask yourself What was actually observed, and what has been inferred from it?
THE SIGNAL CONTINUES
Some discoveries stay with you.
Get the illustrated investigations delivered to your inbox. Then follow the questions that refuse to leave.